In this post, we’ll show you how to monitor the status of your MongoDB servers using Studio 3T’s Server Status Charts feature. Try it today.
Introduction
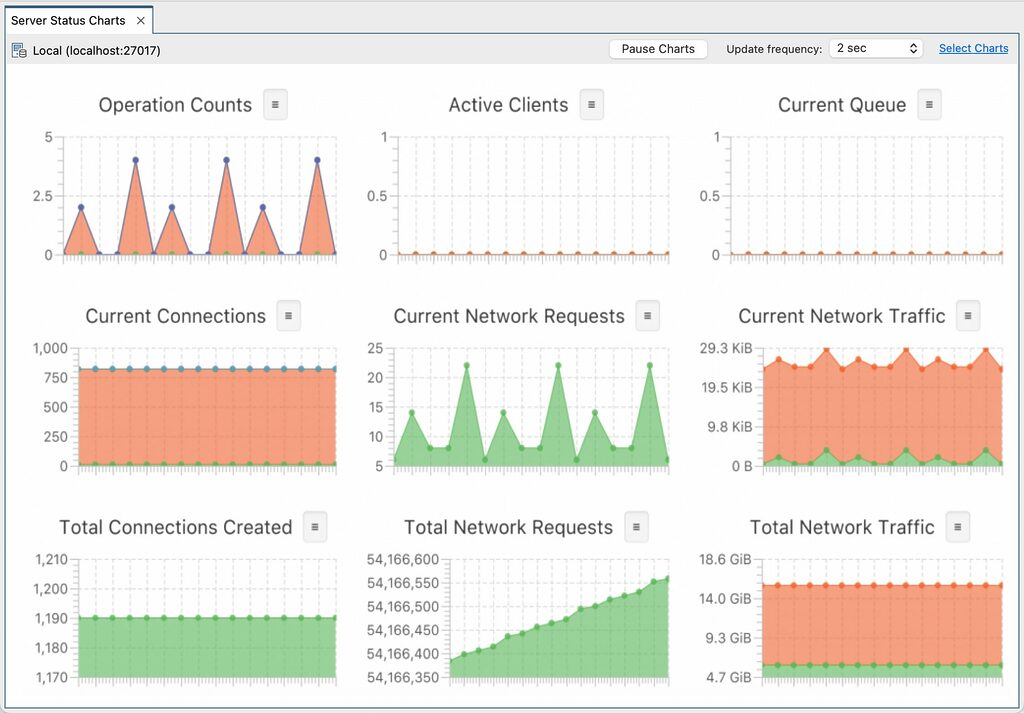
Server Status Charts shows real-time updates of what’s happening on a MongoDB server or database making it easier to monitor production, development, test, or local instances. Server Status Charts uses statistics returned by the MongoDB serverStatus () command to provide insights into database health and the status of an instance, including operations and connections metrics.
Open Server Status Charts
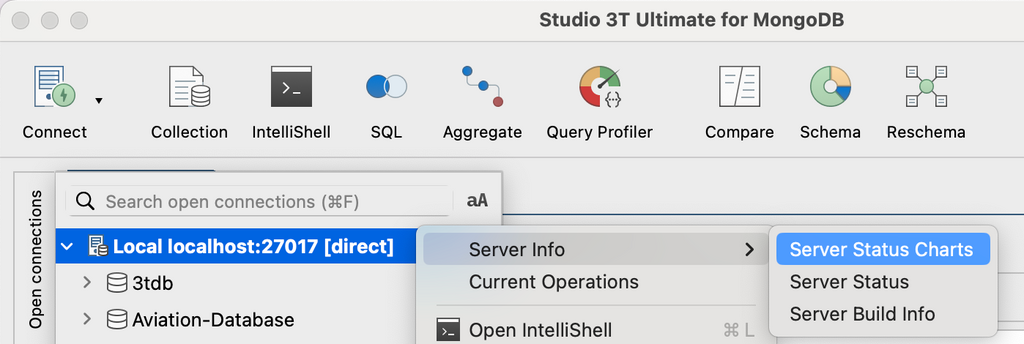
You can open a Server Status Charts tab by right-clicking on a connection (or database, or collection) and selecting Server Status Charts from the Server Info menu.
Choose your charts
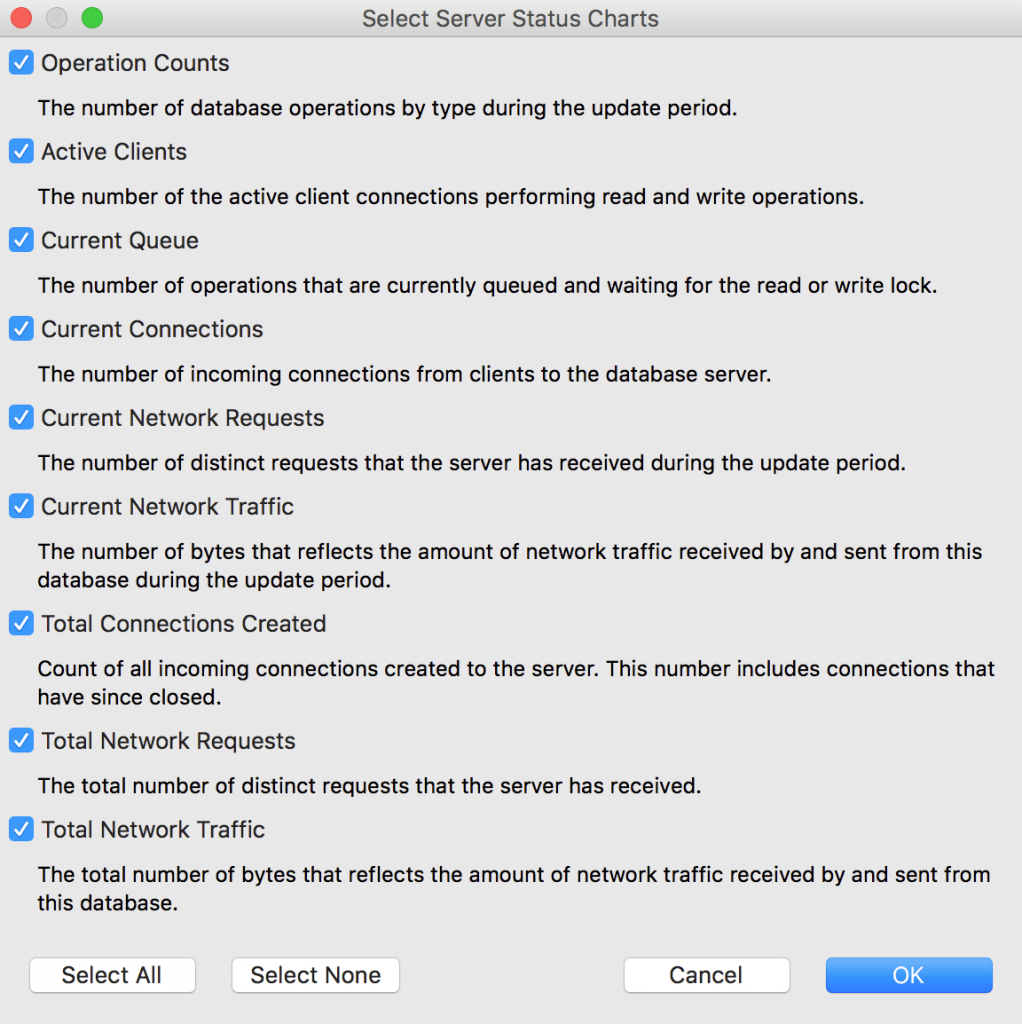
You can customize which charts Studio 3T shows by clicking on Select Charts in the upper right side of the Server Status Charts tab:
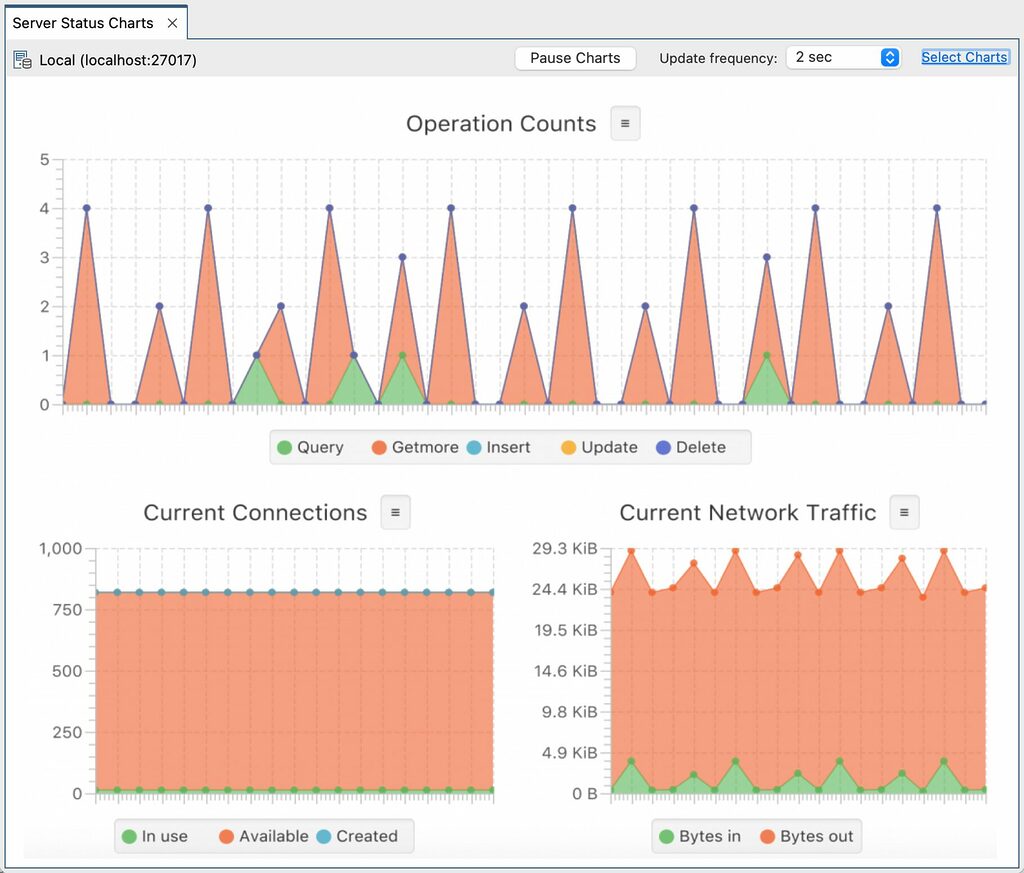
For example, if you want to focus on Operation Counts, Current Connections, and Current Network Traffic, select only those charts and Studio 3T lays them out intelligently for you:
What the MongoDB performance metrics mean
In this section, we’ll explain the information shown on each chart.
Note that the information displayed in the charts may be:
– where the charts show information from the start of a particular point until the present moment, for example all events of a particular type since the database started.
The table below details each of the MongoDB server status charts:
| Operation Counts Per Update Period The number of database operations by type during the update period. |
| Active Clients Point in Time The number of the active client connections performing read and write operations. |
| Current Queue Point in Time The number of operations that are currently queued and waiting for the read or write lock. |
| Current Connections Point in Time / Per Update Period The number of incoming connections from clients to the database server. ‘In use’ and ‘Available’ report the point in time values, ‘Total created’ shows values per update period. |
| Current Network Requests Per Update Period The number of distinct requests that the server has received during the update period. |
| Current Network Traffic Per Update Period The number of bytes that reflects the amount of network traffic received by and sent from this database during the update period. |
| Total Connections Created Cumulative Count of all incoming connections created to the server. This number includes connections that have since closed. |
| Total Network Requests Cumulative The total number of distinct requests that the server has received. |
| Total Network Traffic Cumulative The total number of bytes that reflects the amount of network traffic received by and sent from this database. |
You can find more detailed information about the counters used in the chart data in the MongoDB documentation.